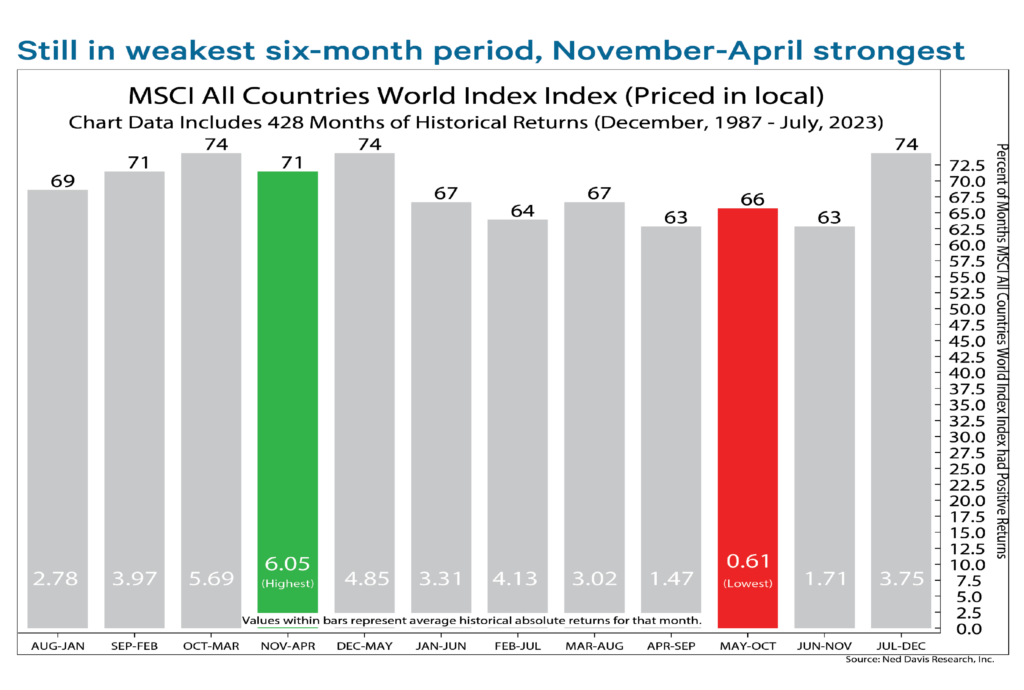
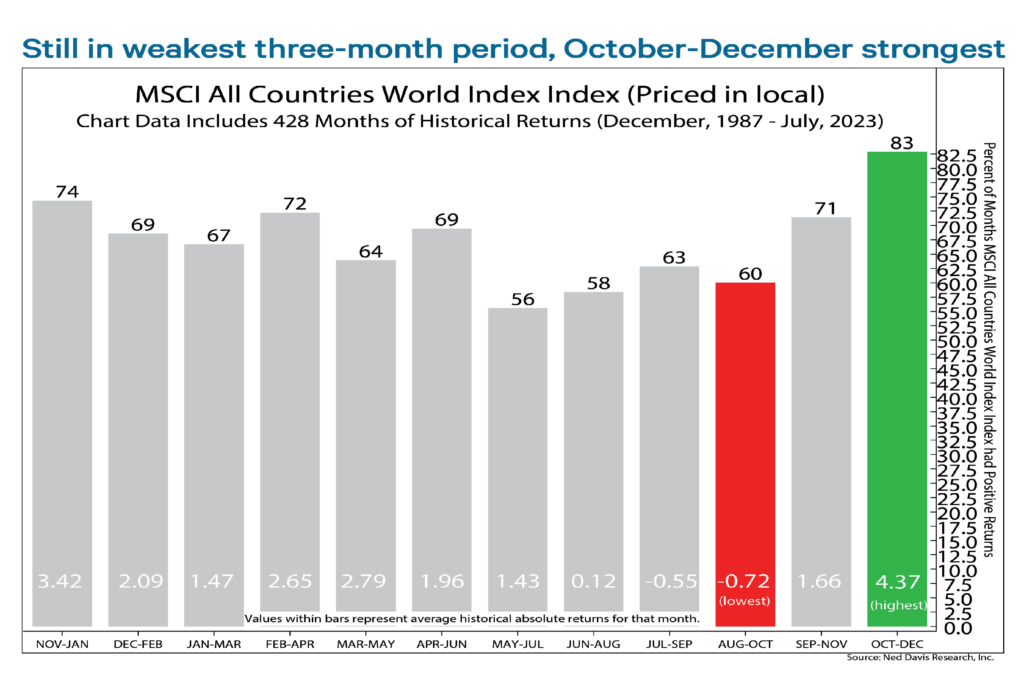
In an Investment Insight update we compiled in September of 2023 titled “Seasonal Trends,” we discussed the historical returns of stocks over various time periods. Given that we are in a similar time of year, we thought it would be worth highlighting how seasonality can trend within stock markets. August of this year started off rocky before recovering to near all-time highs as the month progressed, and September has also begun with a similar pullback. While this is never a perfect exercise, it was notable how closely 2023 tracked these trends, with a strong decline from August to October, bottoming right on October 31 before a dramatic rally to all-time highs to end 2023.
As shown in the following two charts, May through October has been the weakest six-month period for global equities, while November through April has been the strongest. Similarly, three-month trends paint a like picture, with the weakest stretch aligning with our current August through October timeframe before seasonal strength typically appears October through December.


While election years historically have provided heightened volatility leading up to an election, we have also seen historically strong performance after Election Day regardless of which political party is elected to office. While the past can never be fully relied upon for the future, we believe a still historically low unemployment environment, solid corporate earnings, and inflation trends provide a solid foundation for potential improved performance entering 2025.
Due to various factors, including changing market conditions and/or applicable laws, the content may no longer be reflective of current opinions or positions. Moreover, you should not assume that any discussion or information contained in this blog serves as the receipt of, or as a substitute for, personalized investment advice from JNBA Financial Advisors, LLC.
Please see important disclosure information at jnba.com/disclosure


