
January has kicked off 2026 with a full sampling of the same themes from 2025: geopolitical concerns, tariff threats, AI developments, and international equity strength, to name a few. While markets have weathered these various concerns so far, a key indication for how 2026 could shape up is already arriving: earnings season. January and February represent a key period in equity markets where companies typically report their Q4 results as well as (and perhaps more importantly) provide an initial view of guidance for the year ahead.
The JNBA Investment Committee has often referred to the three “pillars” of financial markets or the economy: unemployment, inflation, and corporate earnings. These pillars are not independent from one another. Each data point across the three can help compare and contrast one with another, with all three having various levels of importance depending on the stage of a business cycle.
In a period of lower but steadily rising unemployment rates and elevated but slowly lowering inflation rates, corporate earnings may be the factor that impacts the trend of both for 2026. This earning season represents one of the best initial gauges into how that earnings story may play out this year.
The story of the last several years for equity markets has been above average earnings growth and all-time high profit margins – first from the high-growth Magnificent Seven and slowly broadening out to other industries and sectors. In 2026 and 2027, analysts are expecting profits to continue to grow by 15% each year compared to ~16% in 2025 and 11% in 2024. The headline for Q2 and Q3 in 2025 was the near-record earnings beat rate. Over 80% of S&P 500 companies exceeded consensus estimates in Q2. The percentage climbed to 83.3% in Q3, a level eclipsed only in the aftermath of the COVID shutdowns.
The bar has been raised, and in the coming weeks we’ll begin to see directly from the companies how realistic these earnings expectations truly are. With markets trading at elevated valuations, earnings growth becomes vital for further stock appreciation. We saw this in 2025 when the S&P 500 grew 18% on the back of ~16% earnings growth and 2% P/E multiple expansion.
But how does that tie into the future value of the S&P 500 or the overall growth of the U.S. economy? Valuations have to matter at some point, right? As with most investments, what the asset is expected to do in the future typically plays a bigger role than past performance. Valuations represent what you’re willing to pay for that future performance.
At the same time, by a simple P/E ratio gauge, if earnings were to grow 15% in 2026, valuations would need to decline by more than 15% to cause a negative overall return. These valuations disruptions have happened in the past, but it is often from broader factors in the world which typically indicated earnings expectations were unrealistic and future profits were weaker. Valuations typically don’t change dramatically without a change to future earnings expectations. Simply put, if earnings growth is strong, stock market growth is usually strong as well. With lofty valuations currently being priced in, expectations are high, and markets need to be prepared for what an “acceptable” growth rate really is if results are below the initial strong outlook.
So, what would happen if earnings expectations were to be lower throughout the year? While we invest in a diversified mix of U.S. and global stocks, let’s take a closer look at the S&P 500. The volatility of the last several years, with several annual returns well above and well below the average yearly return, has painted a dramatic near-term image in many investors’ minds. However, when we look back at a longer stretch of economic and market history, a smoother and more stable story emerges.
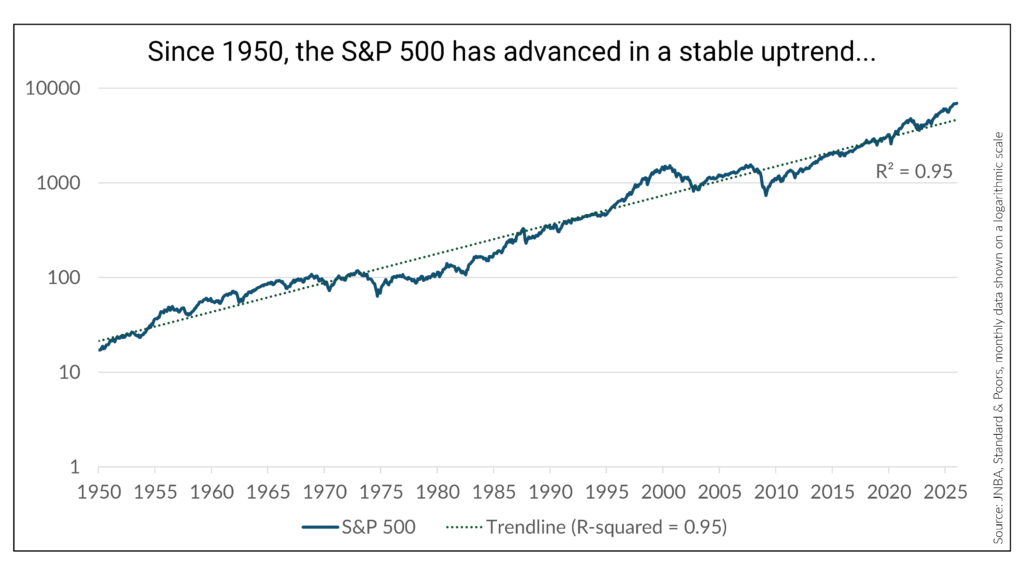
From 1950 until today, the S&P 500 index has grown ~7.8% per year. Investors would also have received dividends along the way, which were not reinvested in this illustration, creating a long-term average total return above 9% fairly consistently over 75 years.
And while the S&P 500 index went from a low value in 1950 to a higher value today, it doesn’t mean the index went from “cheap” to “expensive.” The index actually grew at a similar rate as the earnings of those 500 companies. The race has been nearly even between the value of the S&P 500 itself and the profitability of the companies within the index, with both growing at a mid-7% rate for the last 75 years.
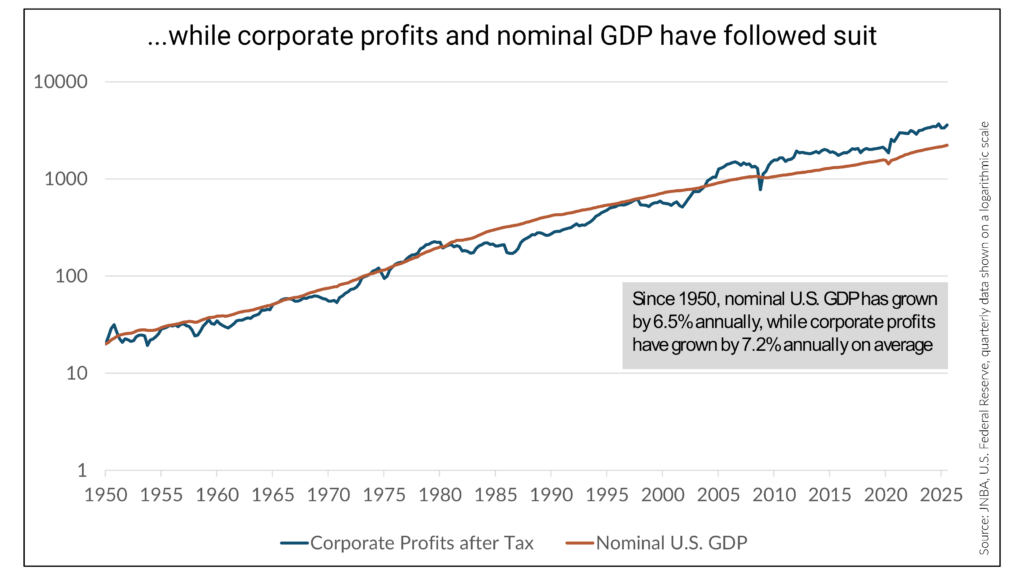
Similarly, we see that the growth in the S&P 500 and corporate earnings also lines up well with the long-term growth of the U.S. economy. Nominal Gross Domestic Product (GDP), which excludes adjustments for inflation – similar to the value of the S&P 500 or corporate profits – has grown at 6.5% annually since 1950. While the S&P 500 and profits have grown slightly higher than GDP in recent decades, that may be explained by the increasing globalization of firms doing more business outside the U.S., which would not be fully reflected in U.S. GDP.
The lines between the stock market and the economy can often blur, but longer-term, what’s good for one is typically good for the other.
It’s important to remember these are all long-term averages, and any given year can represent larger discrepancies between the S&P 500, corporate profits, and GDP. While we are always long-term focused, we are not complacent to rely solely on these trends to deliver on our clients’ goals. 2026 has introduced new and old variables, and the role of earnings in returns for this year and beyond will be one important piece of the puzzle.
As always, if you have any questions, please talk to your JNBA Advisory Team.
Due to various factors, including changing market conditions and/or applicable laws, the content may no longer be reflective of current opinions or positions. Moreover, you should not assume that any discussion or information contained in this blog serves as the receipt of, or as a substitute for, personalized investment advice from JNBA Financial Advisors, LLC.
Please see important disclosure information at jnba.com/disclosure